Refer to the graph below. 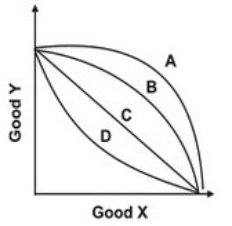 In which curve does the opportunity cost of an additional unit of good Y decrease as more units of good Y are produced?
A) A
B) B
C) C
D) D
Correct Answer:
Verified
Q28: This production possibility table illustrates:
Q29: The principle of increasing marginal opportunity cost
Q30: If there were decreasing marginal opportunity costs,
Q31: To graphically demonstrate the principle of increasing
Q32: Increasing marginal opportunity cost means that the
Q34: Given a production possibility curve for good
Q35: If you move from a point inside
Q36: In the graph shown, what change would
Q37: Refer to the graph shown. In the
Q38: Refer to the graph below. 
Unlock this Answer For Free Now!
View this answer and more for free by performing one of the following actions

Scan the QR code to install the App and get 2 free unlocks

Unlock quizzes for free by uploading documents