This graph shows how people have responded over time to the following question: how much of the time do you think you can trust the government in Washington to do what is right-just about always,most of the time,or only some of the time? 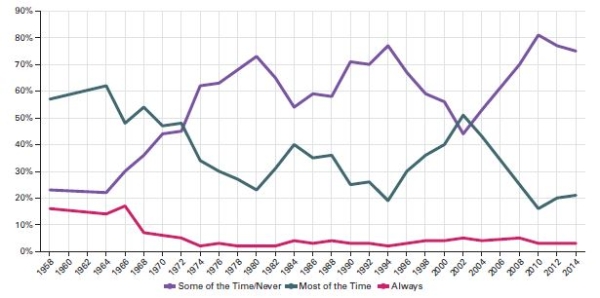 Sources: Authors' analysis of 1958-2012 American National Election Study data.As there were no election
studies for 2006,2010,and 2014,we have used the following sources for those years: December 2006 Pew
Research Center poll; February 5-10,2010 New York Times/CBS News Poll; February 2014 Pew Research
Center poll.
-Which of the following is a possible effect of declining trust in government?
A) a lack of public support for government programs
B) increased support for liberal policies -Consider This: Liberals tend to support the "big government" programs in which people lose faith as trust in the government wanes.
C) more people emigrating from the United States
D) greater voter turnout for midterm elections
Correct Answer:
Verified
Q12: What is demography?
A)the science of population changes
B)an
Q13:
This graph shows how people have responded
Q14: What is a principal provision of the

