Federal Revenues
This is a stacked graph in which the difference between the lines indicates the revenues
raised by each tax. 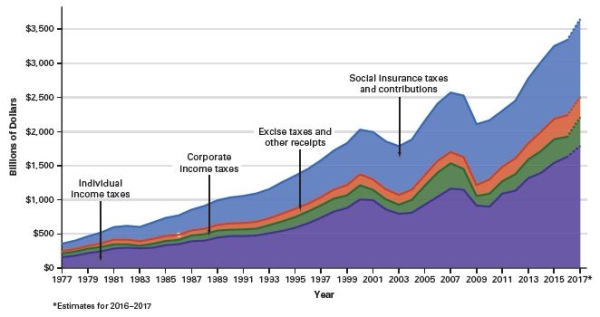 Source: Budget of the United States Government,Fiscal Year 2017: Historical Tables (Washington,D.C.: U.S.
Government Printing Office,2016) ,Table 2.1.
-Based on the graph,what was the largest source of federal revenue in 2017?
A) social insurance taxes -Consider This: These taxes are significant,but do not approach the amount brought in by individual income taxes.
B) excise taxes
C) corporate income taxes
D) individual income taxes
Correct Answer:
Verified
Q1: The U.S.Air Force unveiled its new stealth
Q2:
Trends in social service spending 
Q3: Q5: Total National Debt Q6: The U.S.Air Force unveiled its new stealth Q7: In which of the following years was Q8: Q9: In which of the following years were Unlock this Answer For Free Now! View this answer and more for free by performing one of the following actions Scan the QR code to install the App and get 2 free unlocks Unlock quizzes for free by uploading documents![]()
![]()
Total National Debt ![]()

