Use the following graph for the question. 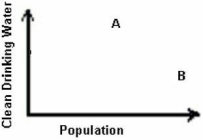
-On the graph of clean drinking water per person,each letter represents a country.Which of the following is most likely?
A) A is the United States;B is India.
B) A is India;B is the United States.
C) A is the United States;B is Canada.
D) A is China;B is India.
E) A is India;B is Canada.
Correct Answer:
Verified
Q30: The National Pollution Discharge Elimination System (NPDES)was
Q31: A TMDC measures the toxicity of a
Q32: An oligotrophic lake would be very productive.
Q33: A(n)_ is all the land drained by
Q34: How much of the total water on
Q35: Raw sewage would contribute to the biochemical
Q36: The hydrologic cycle distributes water across the
Q37: Many cities in the American Southwest rely
Q39: Best available technology (BAT)standards are standards set
Q40: Plants that take up heavy metals found
Unlock this Answer For Free Now!
View this answer and more for free by performing one of the following actions

Scan the QR code to install the App and get 2 free unlocks

Unlock quizzes for free by uploading documents