Refer to the graph shown. Economic output in year 0 is $50 billion. What is potential output in year 2? 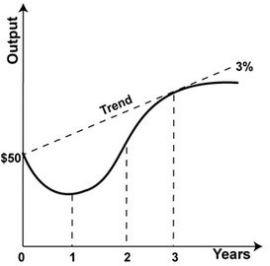
A) $50 billion
B) $51.5 billion
C) $53.0 billion
D) $54.6 billion
Correct Answer:
Verified
Q33: Refer to the graph. The economy begins
Q34: Refer to the graph. Economic output in
Q35: The hypothesis about the macro economy that
Q36: Structural stagnation is used to describe a:
A)downturn,
Q37: Refer to the graph shown. The economy
Q39: Refer to the graph shown. The economy
Q40: Under the standard macro policy, the long-run
Q41: Looking at the globalized AS/AD model, the
Q42: Structural stagnation focuses on _ in terms
Q43: Which of the following statements best describes
Unlock this Answer For Free Now!
View this answer and more for free by performing one of the following actions

Scan the QR code to install the App and get 2 free unlocks

Unlock quizzes for free by uploading documents