In the graph shown, which of the world supply curves create a trade deficit? 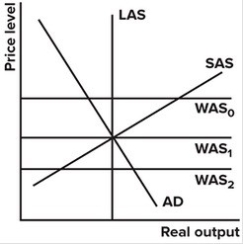
A) WAS0
B) WAS1
C) WAS2
D) None create deficits.
Correct Answer:
Verified
Q63: In the graph shown, an upward shift
Q64: Based on what we know about the
Q65: In the graph shown, which of the
Q66: In the graph shown, the country has:
Q67: In the graph shown, which of the
Q69: According to the structural stagnation model, an
Q70: In the globalized AS/AD model, what curve
Q71: In the graph shown, what would eliminate
Q72: According to the structural stagnation hypothesis, the
Q73: In the graph shown, the globally constrained
Unlock this Answer For Free Now!
View this answer and more for free by performing one of the following actions

Scan the QR code to install the App and get 2 free unlocks

Unlock quizzes for free by uploading documents