In the graph shown, a downward shift in the SAS curve: 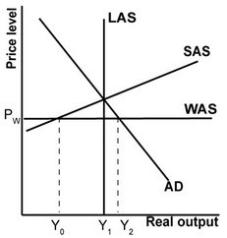
A) raises domestic consumption, because domestic producers produce more.
B) raises the trade deficit, because domestic producers are more competitive.
C) raises domestic production, because input prices have fallen.
D) lowers globalized potential output, because domestic producers are more competitive.
Correct Answer:
Verified
Q73: In the graph shown, the globally constrained
Q74: The gap between a country's potential output
Q75: In the graph shown, what could balance
Q76: In the globalized model, the eventual equivalency
Q77: In the graph shown, a shift in
Q79: Refer to the graph shown. What will
Q80: Looking at the graph shown, the structural
Q81: Which group has fared the worst in
Q82: Suppose a young person asked you for
Q83: Which would help resolve structural stagnation?
A)Domestic exchange
Unlock this Answer For Free Now!
View this answer and more for free by performing one of the following actions

Scan the QR code to install the App and get 2 free unlocks

Unlock quizzes for free by uploading documents