Refer to the graph shown. The relationship represented in the figure is called a: 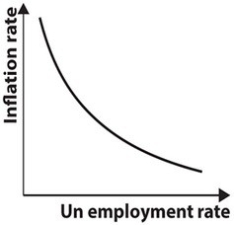
A) labor supply curve.
B) labor demand curve.
C) short-run Phillips curve.
D) long-run Phillips curve.
Correct Answer:
Verified
Q104: Based on the long-run Phillips curve, we
Q105: Along the long-run Phillips curve, inflation and
Q106: If the economy is at Point A
Q107: The slope of the long-run Phillips curve
Q108: As the economy moves to the right
Q110: The Phillips curve represents a relationship between:
A)inflation
Q111: The short-run Phillips curve tells us, in
Q112: The short-run Phillips curve tells policy makers
Q113: On the short-run Phillips curve, the expectations
Q114: Inflationary pressures increase when the economy moves:
A)to
Unlock this Answer For Free Now!
View this answer and more for free by performing one of the following actions

Scan the QR code to install the App and get 2 free unlocks

Unlock quizzes for free by uploading documents