Refer to the graph shown. Expectations of inflation are 2 percent at point(s) : 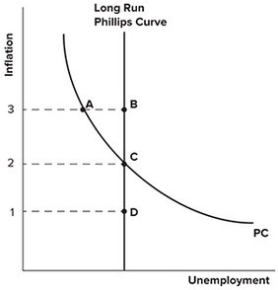
A) A and C.
B) B.
C) D.
D) B, C, and D.
Correct Answer:
Verified
Q112: The short-run Phillips curve tells policy makers
Q113: On the short-run Phillips curve, the expectations
Q114: Inflationary pressures increase when the economy moves:
A)to
Q115: If expected inflation increases:
A)the short-run Phillips curve
Q116: The problem portrayed by the short-run Phillips
Q118: Which of the following remains constant along
Q119: The long-run Phillips curve is:
A)downward-sloping, implying a
Q120: If the economy is at point A
Q121: Refer to the graph shown. 
Q122: Refer to the graphs shown. Which of
Unlock this Answer For Free Now!
View this answer and more for free by performing one of the following actions

Scan the QR code to install the App and get 2 free unlocks

Unlock quizzes for free by uploading documents