Refer to the graph shown. From 1938 to 1943 the Federal deficit rose from $1.0 billion to $53.8 billion due to increased defense spending. The effect of this on the AD curve can be shown by a movement from: 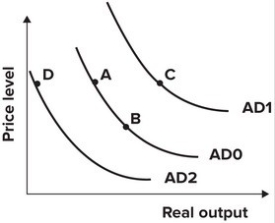
A) A to B.
B) A to C.
C) A to D.
D) B to A.
Correct Answer:
Verified
Q59: The multiplier effect exists because:
A)production and expenditures
Q60: If the money wealth, interest rate, and
Q61: Refer to the graph shown. From 1980
Q62: In the early 1930s, U.S. government expenditures
Q63: If the U.S. government increases its expenditures
Q65: A fall in the value of the
Q66: If the dollar were to depreciate against
Q67: The new government of Pakistan transfers money
Q68: To combat inflation in 1955 and 1956,
Q69: If total income in Sweden remains the
Unlock this Answer For Free Now!
View this answer and more for free by performing one of the following actions

Scan the QR code to install the App and get 2 free unlocks

Unlock quizzes for free by uploading documents