Refer to the graph shown. In 1975 U.S. President Gerald Ford instituted a large tax cut. At the same time, the Fed expanded the money supply. The effect of these policies on the AD curve is best shown as a movement from: 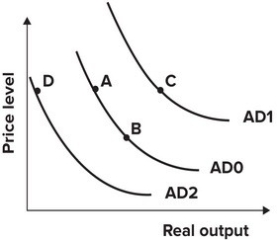
A) A to B.
B) D to A.
C) A to D.
D) B to A.
Correct Answer:
Verified
Q73: If total income remains the same but
Q74: Refer to the graph shown. In 1930,
Q75: Refer to the graph shown. From 1929
Q76: If the U.S. government increases its expenditures
Q77: If the U.S. government increased taxes without
Q79: Suppose the Brazilian currency, the real, depreciates
Q80: From 1975 to 1995, the value of
Q81: If workers begin to expect more inflation
Q82: With an upward-sloping short-run aggregate supply curve,
Q83: During the Vietnam War, Congress increased government
Unlock this Answer For Free Now!
View this answer and more for free by performing one of the following actions

Scan the QR code to install the App and get 2 free unlocks

Unlock quizzes for free by uploading documents