Refer to the following graph. 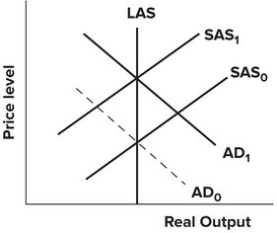 The massive increase in defense spending is best represented by the:
A) AD curve shifting from AD0 to AD1.
B) AD curve shifting from AD1 to AD0.
C) SAS curve shifting from SAS0 to SAS1.
D) SAS curve shifting from SAS1 to SAS0.
Correct Answer:
Verified
Q148: Refer to the graph shown. In the
Q149: Suppose that consumer spending is expected to
Q150: Refer to the graph shown. If the
Q151: Refer to the graph shown. In the
Q152: An economy's resources:
A)can never be overutilized.
B)can always
Q154: Refer to the graph shown. An expansionary
Q155: Refer to the graph shown. A policy
Q156: Refer to the graph shown. No changes
Q157: Refer to the graph shown. If the
Q158: The presence of wage and price controls
Unlock this Answer For Free Now!
View this answer and more for free by performing one of the following actions

Scan the QR code to install the App and get 2 free unlocks

Unlock quizzes for free by uploading documents