Refer to the graph shown. Between points C and D, marginal utility is: 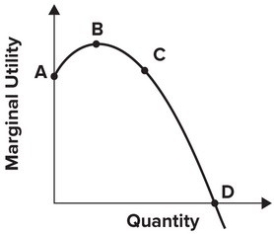
A) decreasing, and so total utility is falling.
B) positive, and so total utility is increasing.
C) positive, and so total utility is falling.
D) decreasing, and so total utility is at its maximum.
Correct Answer:
Verified
Q24: Jack Sprat could eat no fat, his
Q31: Suppose that the total utility of consuming
Q32: What is the marginal utility of
Q33: Refer to the graph shown. Between points
Q34: Refer to the following graph. 
Q34: As long as total utility is increasing,
Q35: Refer to the graph shown. Total utility
Q39: Refer to the following table. Fill
Q48: Diminishing marginal utility implies that as an
Q59: Given a set amount of money, goods
Unlock this Answer For Free Now!
View this answer and more for free by performing one of the following actions

Scan the QR code to install the App and get 2 free unlocks

Unlock quizzes for free by uploading documents