Refer to the graph shown. A consumer would be expected to change consumption from point A to point B in response to a(n) : 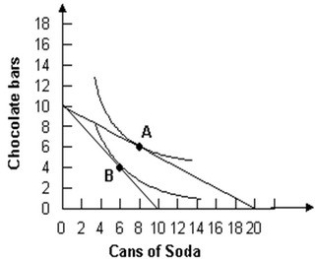
A) increase in the price of soda.
B) increase in the price of chocolate bars.
C) increase in income.
D) decrease in the price of soda.
Correct Answer:
Verified
Q5: How does the principle of diminishing marginal
Q6: What two assumptions underlie economists' theory of
Q7: Economists' formal analysis requires two pieces of
Q8: The utility maximizing rule states that "if
Q11: Give two explanations of individual choice other
Q15: The three major assumptions underlying the economist's
Q124: Using indifference curve analysis, you can identify
Q135: Refer to the graphs shown. 
Q136: Refer to the graph shown.
Q139: Refer to the graphs shown, which show
Unlock this Answer For Free Now!
View this answer and more for free by performing one of the following actions

Scan the QR code to install the App and get 2 free unlocks

Unlock quizzes for free by uploading documents