Refer to the graph shown. 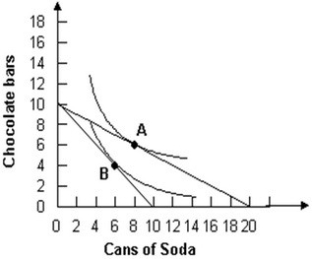 The diagram demonstrates that an increase in the price of soda will:
A) raise the quantity demanded of soda.
B) reduce the quantity demanded of soda.
C) raise the quantity demanded of chocolate bars.
D) raise the consumer's available income.
Correct Answer:
Verified
Q3: How does the principle of rational choice
Q8: The utility maximizing rule states that "if
Q11: Give two explanations of individual choice other
Q12: What is the principle of rational choice?
Q19: What is meant by "utility" and how
Q122: Using the indifference curve model, a demand
Q125: Refer to the graphs shown, which show
Q126: Refer to the graph shown. 
Q129: Refer to the graph shown.
Q135: Refer to the graphs shown.
Unlock this Answer For Free Now!
View this answer and more for free by performing one of the following actions

Scan the QR code to install the App and get 2 free unlocks

Unlock quizzes for free by uploading documents