Refer to the graph shown. Area B represents: 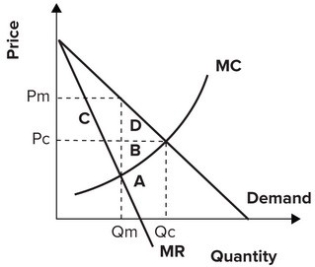
A) the loss of surplus by consumers resulting from a monopoly.
B) the cost to society of increasing output from Qm to Qc.
C) consumer surplus redistributed to the monopolist.
D) the loss of surplus by producers resulting from a monopoly.
Correct Answer:
Verified
Q63: Refer to the graph shown. Suppose the
Q65: Refer to the graph shown. Assuming that
Q66: Refer to the graph shown. Area C
Q67: Refer to the graph shown. If a
Q68: Suppose a monopolist is at the profit-maximizing
Q69: Refer to the graph shown. Areas C
Q70: Refer to the graph shown. If hamburgers
Q71: Refer to the graph shown. Assuming that
Q73: Refer to the graph shown. If hamburgers
Q78: The deadweight loss from monopoly exists because:
A)
Unlock this Answer For Free Now!
View this answer and more for free by performing one of the following actions

Scan the QR code to install the App and get 2 free unlocks

Unlock quizzes for free by uploading documents