Using the following diagram,demonstrate graphically and explain verbally why any movement away from output level Q0 would decrease the firm's profit. 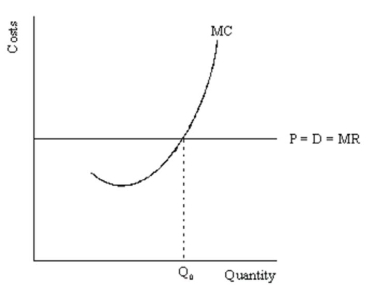
Correct Answer:
Verified
View Answer
Unlock this answer now
Get Access to more Verified Answers free of charge
Q3: How does a market supply curve relate
Q6: How are normal profits related to economic
Q8: Explain, using an example if necessary to
Q9: In determining the supply curve of a
Q11: Perfectly competitive firms are price takers. However,
Q12: Some firms, particularly but not exclusively Japanese
Q20: Define a perfectly competitive market, and list
Q139: Refer to the graphs shown, which depict
Q140: Refer to the graphs shown, which depict
Q148: Using the following diagram,demonstrate graphically and explain
Unlock this Answer For Free Now!
View this answer and more for free by performing one of the following actions

Scan the QR code to install the App and get 2 free unlocks

Unlock quizzes for free by uploading documents