The graph shown exhibits diseconomies of scale: 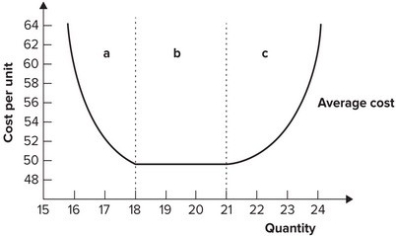
A) in region a.
B) in region b.
C) in region c.
D) over the entire range of output.
Correct Answer:
Verified
Q21: Since capital is relatively scarce in India,
Q33: When carmakers began to cut the costs
Q35: If the demand for flat screen television
Q36: Refer to the graph shown. If the
Q40: A firm can use 5 workers and
Q41: The level of production that minimizes long-run
Q43: Refer to the graph shown. If the
Q45: Refer to the graph shown. The output
Q53: Diseconomies of scale are associated with:
A) an
Q56: The upward-sloping part of the long-run average
Unlock this Answer For Free Now!
View this answer and more for free by performing one of the following actions

Scan the QR code to install the App and get 2 free unlocks

Unlock quizzes for free by uploading documents