Refer to the graph shown. A firm planning to produce 1,500 units of output would choose the scale of operation represented by: 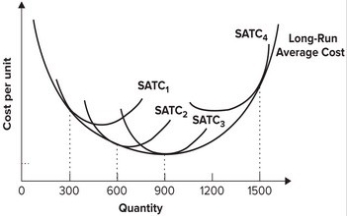
A) SATC1.
B) SATC2.
C) SATC3.
D) SATC4.
Correct Answer:
Verified
Q61: Which of the following provides the best
Q75: Refer to the graph shown. A firm
Q76: Refer to the graph shown. If a
Q77: Refer to the graph shown. If a
Q78: Refer to the graph shown. If a
Q82: An entrepreneur most likely would develop a
Q85: The long-run average cost curve is tangent
Q90: Expected economic profit per unit is equal
Q92: "For-benefit" corporations are created to pursue multiple
Q96: The reason for the merger of two
Unlock this Answer For Free Now!
View this answer and more for free by performing one of the following actions

Scan the QR code to install the App and get 2 free unlocks

Unlock quizzes for free by uploading documents