Refer to the graph shown. The least-cost method of producing 1,000 units of output is shown at point: 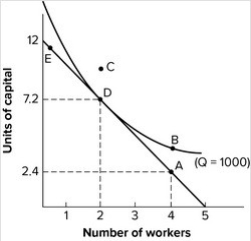
A) A.
B) B.
C) C.
D) D.
Correct Answer:
Verified
Q4: The SRATC and LRATC curves are both
Q7: Suppose you can produce 50 gourmet pizzas
Q10: If all production relationships were technical relationships,
Q18: Why is it that a technically efficient
Q102: If technological innovation occurs when a firm
Q108: Isoquants slope downward because:
A) average total costs
Q116: Technological change:
A) reduces average total cost without
Q117: Refer to the graph shown. The cost
Q119: If labor costs $10 per unit and
Q122: Refer to the graph shown. If the
Unlock this Answer For Free Now!
View this answer and more for free by performing one of the following actions

Scan the QR code to install the App and get 2 free unlocks

Unlock quizzes for free by uploading documents