Refer to the graph shown. The line segment that represents average total costs of producing Q* is: 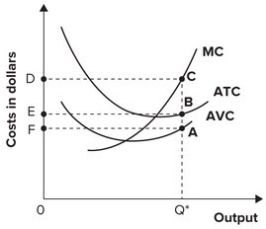
A) AQ*.
B) BQ*.
C) CQ*.
D) AB.
Correct Answer:
Verified
Q105: If a firm's average fixed cost is
Q114: When output is 20, fixed costs are
Q118: Refer to the table shown. The
Q121: Refer to the graph shown. This set
Q122: Refer to the following graph. 
Q124: The following graph shows average fixed costs,
Q124: Which of the following cost curves is
Q126: The following graph shows average fixed costs,
Q128: Refer to the graph shown. Total cost
Q131: The typical average variable cost curve:
A) is
Unlock this Answer For Free Now!
View this answer and more for free by performing one of the following actions

Scan the QR code to install the App and get 2 free unlocks

Unlock quizzes for free by uploading documents