Refer to the graph shown. In equilibrium, total surplus is equal to: 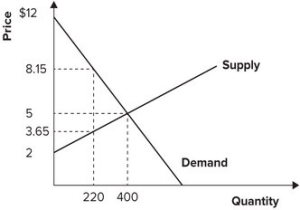
A) 600.
B) 1,200.
C) 1,400.
D) 2,000.
Correct Answer:
Verified
Q1: Unlike excise taxes, price ceilings create no
Q4: Refer to the graph shown. In equilibrium,
Q6: The total cost of taxation to consumers
Q7: Refer to the graph shown. In equilibrium,
Q10: Total producer surplus is measured as the
Q11: When the market is in equilibrium, total
Q12: If the government's goal is to alter
Q16: The distance between the supply curve and
Q18: If the demand for Insulin is highly
Q20: If a tax is legally required to
Unlock this Answer For Free Now!
View this answer and more for free by performing one of the following actions

Scan the QR code to install the App and get 2 free unlocks

Unlock quizzes for free by uploading documents