Refer to the graph shown. When the market is in equilibrium, total surplus is area: 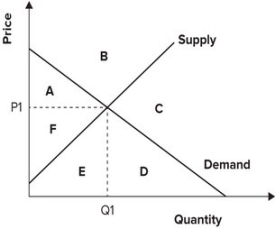
A) A plus area B.
B) E plus area F.
C) A plus area F.
D) A plus area F plus area E plus area D.
Correct Answer:
Verified
Q26: Refer to the graph shown. When the
Q27: Refer to the graph shown. If the
Q28: Refer to the graph shown. If price
Q29: Refer to the graph shown. If consumers
Q30: Refer to the graph shown. The difference
Q32: There is no deadweight loss if:
A) demand
Q33: If price is increased by law from
Q34: Refer to the graph shown. When the
Q35: Refer to the graph shown. If the
Q36: Refer to the graph shown. Total surplus
Unlock this Answer For Free Now!
View this answer and more for free by performing one of the following actions

Scan the QR code to install the App and get 2 free unlocks

Unlock quizzes for free by uploading documents