Refer to the graph shown. Assume the market is initially in equilibrium at point b in the graph but the imposition of a per-unit tax on this product shifts the supply curve up from S0 to S1. The amount of revenue government will collect from this tax is equal to the: 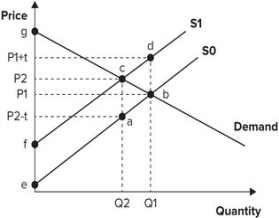
A) amount of the per-unit tax multiplied by Q1.
B) amount of the per-unit tax multiplied by Q2.
C) area of the triangle abc.
D) area of the triangle bcd.
Correct Answer:
Verified
Q48: Refer to the graph shown. Assume that
Q49: Refer to the graph shown. Assume that
Q50: Refer to the graph shown. Assume that
Q50: A per-unit tax will result in a
Q51: A per-unit tax on coffee paid by
Q52: Refer to the graph shown. Assume that
Q54: Graphically, deadweight loss is shown by the:
A)
Q54: Refer to the graph shown. Assume that
Q55: Refer to the graph shown. Assume that
Q56: Refer to the graph shown. Assume the
Unlock this Answer For Free Now!
View this answer and more for free by performing one of the following actions

Scan the QR code to install the App and get 2 free unlocks

Unlock quizzes for free by uploading documents