Refer to the graphs shown. The most tax revenue collected by a given per-unit tax on producers is shown by graphs: 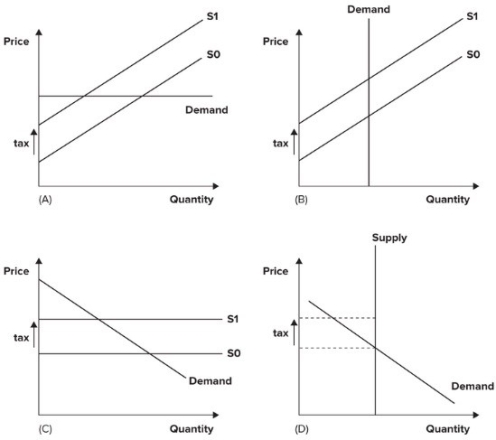
A) A and D.
B) B and C.
C) C and D.
D) B and D.
Correct Answer:
Verified
Q79: If the supply curve is perfectly elastic,
Q79: Refer to the graph shown. Assume that
Q81: Refer to the graph shown. The burden
Q82: Suppose the equilibrium price of textbooks is
Q83: Refer to the following graph. 
Q86: If elasticity of demand is 1.8, elasticity
Q87: Refer to the following graph.
Q88: If demand is perfectly inelastic, the burden
Q96: Given the same price elasticity of supply,
Q97: If elasticity of demand is 0.7, elasticity
Unlock this Answer For Free Now!
View this answer and more for free by performing one of the following actions

Scan the QR code to install the App and get 2 free unlocks

Unlock quizzes for free by uploading documents