Refer to the following graph. 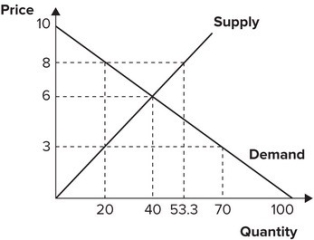 With an effective price ceiling at $3, the effect is an implicit tax on:
A) suppliers equal to $60.
B) suppliers equal to $80.
C) consumers equal to $60.
D) consumers equal to $80.
Correct Answer:
Verified
Q132: Refer to the graph shown. With an
Q133: Refer to the graph shown. An effective
Q135: Refer to the graph shown. With an
Q136: Refer to the graph shown. An effective
Q138: Refer to the graph shown. With an
Q139: Suppose there are 1,825 taxi medallions in
Q139: Refer to the graph shown. With an
Q140: Refer to the graph shown. An effective
Q141: Refer to the graph shown. With an
Q151: When demand is highly inelastic and supply
Unlock this Answer For Free Now!
View this answer and more for free by performing one of the following actions

Scan the QR code to install the App and get 2 free unlocks

Unlock quizzes for free by uploading documents