Refer to the graph shown. When market supply shifts from S0 to S1, the revenue gain to suppliers resulting from increased quantity demanded is shown by area: 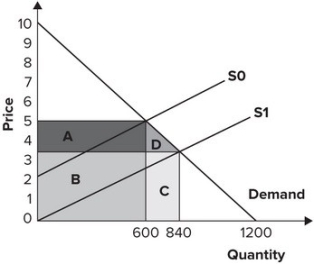
A) A.
B) B.
C) C.
D) D.
Correct Answer:
Verified
Q1: What are the three costs of taxation?
Q8: How are price ceilings similar to taxes?
Q17: What are rent-seeking activities? Give an example.
Q18: Define consumer surplus and producer surplus. Explain
Q153: As a result of advances in productivity,
Q155: Refer to the graph shown. Initially, the
Q157: Refer to the graph shown. The segment
Q157: Which of the following statements is true?
A)
Q158: Refer to the graph shown. An effective
Q162: Refer to the graph shown. In the
Unlock this Answer For Free Now!
View this answer and more for free by performing one of the following actions

Scan the QR code to install the App and get 2 free unlocks

Unlock quizzes for free by uploading documents