Refer to the graph shown. The segment of the demand curve between the initial equilibrium price of $5.00 and the new equilibrium price of $3.00 is: 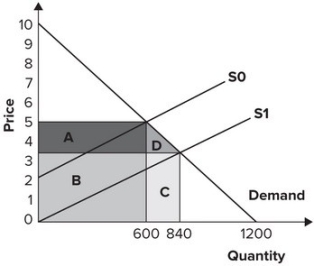
A) elastic.
B) inelastic.
C) perfectly elastic.
D) perfectly inelastic.
Correct Answer:
Verified
Q17: What are rent-seeking activities? Give an example.
Q152: Refer to the graph shown. With an
Q153: Refer to the graph shown. After an
Q153: As a result of advances in productivity,
Q154: Refer to the graph shown. An effective
Q155: Refer to the graph shown. Initially, the
Q157: Which of the following statements is true?
A)
Q158: Refer to the graph shown. An effective
Q160: Refer to the graph shown. When market
Q162: Refer to the graph shown. In the
Unlock this Answer For Free Now!
View this answer and more for free by performing one of the following actions

Scan the QR code to install the App and get 2 free unlocks

Unlock quizzes for free by uploading documents