Refer to the graph shown. The elasticity of demand is closest to 1 on line segment: 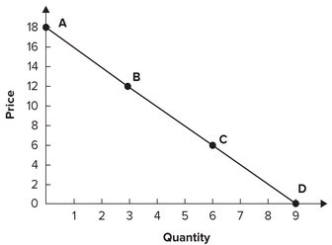
A) AB.
B) BC.
C) CD.
D) The elasticity is not close to 1 on any of these line segments.
Correct Answer:
Verified
Q23: As the price of tomatoes fell from
Q43: Refer to the graph shown. Calculate the
Q46: Compute the approximate elasticity of demand
Q47: Refer to the graph shown. The approximate
Q48: Refer to the graph shown. Demand is
Q49: Compute the approximate elasticity of supply from
Q50: Refer to the graph shown. The approximate
Q53: If the price elasticity of demand for
Q56: If quantity demanded does not change when
Q58: If the percentage increase in the quantity
Unlock this Answer For Free Now!
View this answer and more for free by performing one of the following actions

Scan the QR code to install the App and get 2 free unlocks

Unlock quizzes for free by uploading documents