Refer to the graph shown. When price rises from $30 to $40: 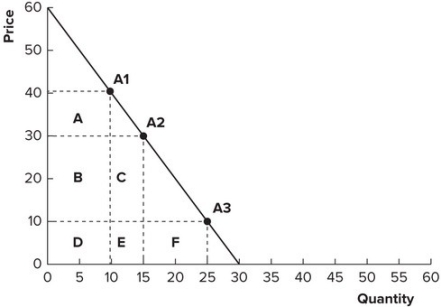
A) lost revenue is represented by areas C and E and gained revenue is represented by area A.
B) gained revenue is represented by areas C and E and lost revenue is represented by area A.
C) lost revenue is represented by areas B, C, D, and E and gained revenue is represented by area A.
D) gained revenue is represented by areas B, C, D, and E and lost revenue is represented by area A.
Correct Answer:
Verified
Q101: Elasticity of demand for bus services is
Q103: Compared to the elasticity of demand for
Q104: In Massachusetts, the price elasticity of license
Q109: During World War II, the price of
Q111: In California, the price elasticity for vanity
Q112: The demand for a good is elastic.
Q114: The price elasticity of demand for insulin
Q115: If elasticity of demand is greater than
Q116: Which of the following most likely correctly
Q118: The president of a college has been
Unlock this Answer For Free Now!
View this answer and more for free by performing one of the following actions

Scan the QR code to install the App and get 2 free unlocks

Unlock quizzes for free by uploading documents