Refer to the graph shown. Area F is: 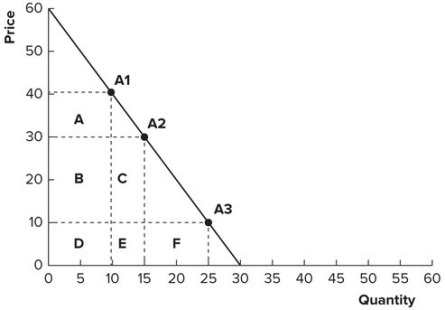
A) smaller than areas B and C, because demand is elastic between $10 and $30.
B) larger than areas B and C, because demand is elastic between $10 and $30.
C) larger than areas B and C, because demand is inelastic between $10 and $30.
D) smaller than areas B and C, because demand is inelastic between $10 and $30.
Correct Answer:
Verified
Q109: During World War II, the price of
Q111: In California, the price elasticity for vanity
Q117: If elasticity of demand is less than
Q119: Along a downward-sloping straight-line demand curve beginning
Q120: Refer to the graph shown. When price
Q125: Refer to the graph shown. Between points
Q126: Refer to the graph shown. Area C
Q131: For necessities, income elasticity is any value:
A)
Q137: An economist estimates that with every 20
Q138: An economist estimates that on average, for
Unlock this Answer For Free Now!
View this answer and more for free by performing one of the following actions

Scan the QR code to install the App and get 2 free unlocks

Unlock quizzes for free by uploading documents