Refer to the following graph. 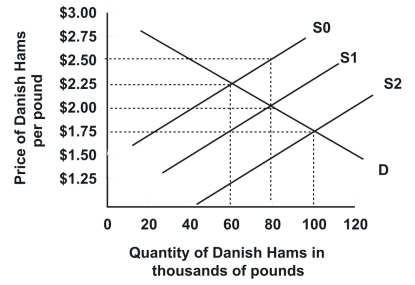 Demand and supply are initially D and S1, respectively. Which of the following best describes the effect of a $0.50 per pound tariff on Danish hams imported into the United States?
A) Supply shifts from S1 to S2; quantity sold rises to 100 thousand pounds and price paid by consumers declines to $1.75 a pound
B) Neither supply nor demand shift, but price paid by consumers declines to $1.50 a pound while quantity sold remains at 80 thousand pounds
C) Supply shifts from S1 to S0; quantity sold declines to 60 thousand pounds and price paid by consumers rises to $2.50 a pound
D) Supply shifts from S1 to S0; quantity sold declines to 60 thousand pounds and price paid by consumers rises to $2.25 a pound
Correct Answer:
Verified
Q61: Which price ceiling will cause the greatest
Q66: If the government imposes an excise tax
Q78: Refer to the graph shown. Without government
Q81: Refer to the graph shown that depicts
Q82: Refer to the following graph. 
Q85: Refer to the graph shown that depicts
Q86: Refer to the graph shown. Given supply,
Q87: Refer to the graph shown. A quantity
Q88: Refer to the graph shown that depicts
Q99: Quantity restrictions become more valuable to those
Unlock this Answer For Free Now!
View this answer and more for free by performing one of the following actions

Scan the QR code to install the App and get 2 free unlocks

Unlock quizzes for free by uploading documents