Refer to the following graph. 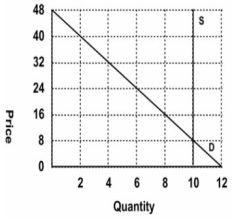 Which of the following pairs of equations describes the supply and demand curves?
A) Qs = 10; Qd = 12 − 0.25P, respectively
B) Qs = 10; Qd = 48 − 2P, respectively
C) Qs = P; Qd = 0.25P + 22, respectively
D) Cannot be determined
Correct Answer:
Verified
Q1: Define an excise tax and give three
Q122: Given the equations for demand and supply:
Q125: Consider a market for fish whose market
Q126: Suppose that initially, supply is given by
Q127: Suppose that the market labor supply and
Q130: Suppose that initially, supply is given by
Q131: Suppose that the market labor supply and
Q132: Suppose that initially, the equations for demand
Q135: Suppose that initially, demand is given by
Q136: Given the equations for demand and supply:
Unlock this Answer For Free Now!
View this answer and more for free by performing one of the following actions

Scan the QR code to install the App and get 2 free unlocks

Unlock quizzes for free by uploading documents