Refer to the graphs shown. Assume the graph reflects demand in the automobile market. Which arrow best captures the impact of increased gasoline prices on the automobile market? 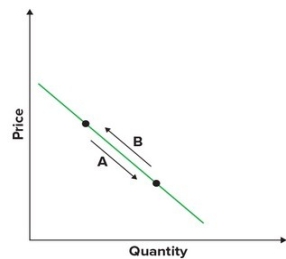
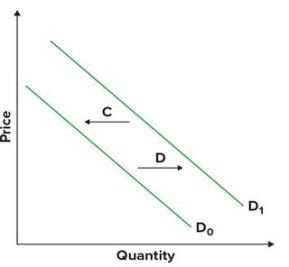
A) A
B) B
C) C
D) D
Correct Answer:
Verified
Q37: Given that diesel cars get much better
Q41: According to the law of supply:
A) supply
Q42: Consider the following demand table and
Q43: To derive a market demand curve from
Q44: Refer to the graphs shown. An increase
Q48: Refer to the table that presents
Q49: Refer to the graphs shown. The curve
Q50: Which statement is not consistent with the
Q53: According to the law of supply, what
Q58: The law of supply states that, other
Unlock this Answer For Free Now!
View this answer and more for free by performing one of the following actions

Scan the QR code to install the App and get 2 free unlocks

Unlock quizzes for free by uploading documents