Refer to the graphs shown. The arrow that would best illustrate the impact on consumers of reducing sales tax on a good paid by suppliers is: 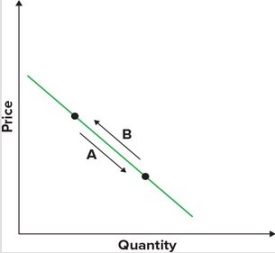
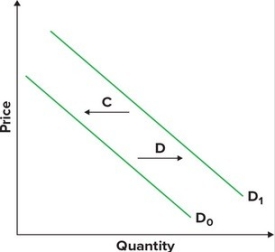
A) A.
B) B.
C) C.
D) D.
Correct Answer:
Verified
Q48: Suppose farmers can use their land to
Q51: The law of supply states that, other
Q52: Refer to the following graphs:
Q53: Given the graph, the quantity that would
Q54: Refer to the graph showing the demand
Q56: Assume the graph shown reflects demand in
Q58: The law of supply states that, other
Q58: Refer to the graphs shown. Assume the
Q59: Given the graph, the quantity that would
Q60: Refer to the table that presents
Unlock this Answer For Free Now!
View this answer and more for free by performing one of the following actions

Scan the QR code to install the App and get 2 free unlocks

Unlock quizzes for free by uploading documents