The diagram below represents the consumer side of the market for skateboards in New York.The current price of skateboards is PA.Each of the events described below will have some impact on the demand for skateboards.For each event,draw a picture to illustrate the effect of the event.Be sure to explain your pictures using pertinent economic terminology ("movement along" or "shift in"). 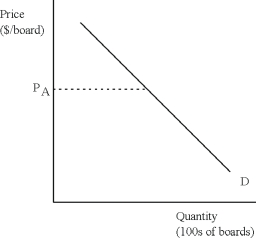 (a)A drop in the price of skateboards.
(b)A drop in the price of kneepads.
(c)A decline in income.
Correct Answer:
Verified
View Answer
Unlock this answer now
Get Access to more Verified Answers free of charge
Q4: Explain the error in the following statement:
Q5: What is equilibrium? Explain what it means
Q16: What is meant by "the fallacy of
Q24: Demonstrate graphically and explain verbally the concept
Q161: Given the following individual supply tables
Q162: The market for Columbian coffee beans is
Q166: Consider the following supply table,which represents
Q167: Consider the following supply and demand picture
Q168: Given the following individual demand tables
Q169: Consider the following demand table,which represents
Unlock this Answer For Free Now!
View this answer and more for free by performing one of the following actions

Scan the QR code to install the App and get 2 free unlocks

Unlock quizzes for free by uploading documents