Refer to the graph below. 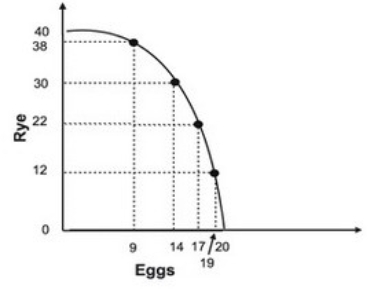 The graph indicates that as more eggs are produced, the marginal opportunity cost of:
A) both eggs and rye increases.
B) eggs increases while the marginal opportunity cost of rye remains constant.
C) eggs increases while the marginal opportunity cost of rye decreases.
D) eggs decreases while the marginal opportunity cost of rye remains constant.
Correct Answer:
Verified
Q21: The principle of increasing marginal opportunity costs
Q25: Refer to the graph shown. Given the
Q27: If a production possibility curve representing a
Q28: In the graph shown, what change would
Q29: The principle of increasing marginal opportunity cost
Q29: Refer to the graph below. 
Q30: If there were decreasing marginal opportunity costs,
Q30: Given the production possibility curve shown below,
Q31: To graphically demonstrate the principle of increasing
Q32: Increasing marginal opportunity cost means that the
Unlock this Answer For Free Now!
View this answer and more for free by performing one of the following actions

Scan the QR code to install the App and get 2 free unlocks

Unlock quizzes for free by uploading documents