The table below is a production possibility table for the fictional country of Myopia.Use it to construct the corresponding production possibility curve in the quadrant below.(Label the axes. ) 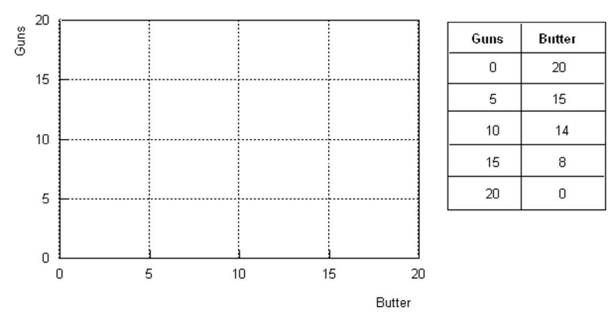 (a)Explain the meaning of a production possibilities curve.
(b)What is assumed to be constant when we draw that curve?
(c)How is a point on the curve different from (1)a point inside the curve or (2)a point outside the curve?
(d)How does this curve illustrate the concept of opportunity cost?
(e)How does it illustrate the principle of increasing marginal opportunity cost?
Correct Answer:
Verified
View Answer
Unlock this answer now
Get Access to more Verified Answers free of charge
Q5: Assume that Belgium and Pakistan have linear
Q6: What is a production possibilities curve?
Q8: What does a production possibilities table demonstrate?
Q9: What two lessons can you learn from
Q15: Most advanced nations have both agricultural sectors
Q101: What is 25 percent of 200?
A) 8
B)
Q103: A downward-sloping line that makes a 45-degree
Q108: An inverse relationship occurs between two variables
Q109: Consider the following information, which provides
Q110: If the quantity demanded for a good
Unlock this Answer For Free Now!
View this answer and more for free by performing one of the following actions

Scan the QR code to install the App and get 2 free unlocks

Unlock quizzes for free by uploading documents