Consider the following information about production of wine and food in England and France: (a) Using the grids below, plot each country's production possibilities curve. 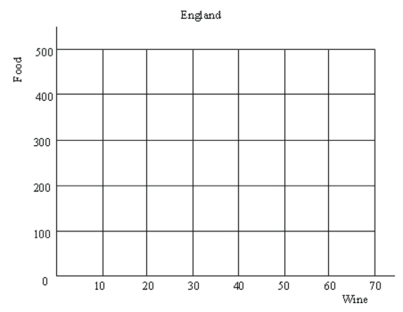
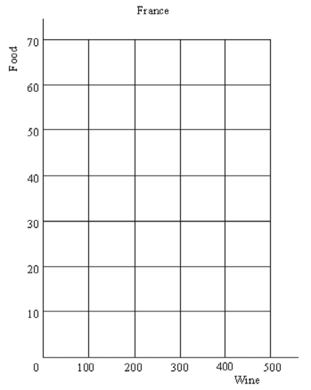 (b) Which country has a comparative advantage in the production of food? Of wine? Explain.
(c) Suppose that currently England and France are not trading with each other.England is producing (and consuming) 200 tons of food and 30 gallons of wine.France is producing (and consuming) 30 tons of food and 200 gallons of wine.As an international trader, how could you take advantage of this situation and make the big bucks?
Correct Answer:
Verified
View Answer
Unlock this answer now
Get Access to more Verified Answers free of charge
Q1: Seamus "Skip" Cavanaugh often travels between Switzerland
Q2: Why does the distribution of costs and
Q3: What are sources of U.S. comparative advantage?
Q4: Explain why economists' and laypeople's' views of
Q6: Explain the principle of comparative advantage. Does
Q7: What is meant by the dollar-euro exchange
Q10: Is a small or large country likely
Q11: Suppose as a result of a recession
Q12: The United States dominates world markets for
Q13: In this problem you will demonstrate your
Unlock this Answer For Free Now!
View this answer and more for free by performing one of the following actions

Scan the QR code to install the App and get 2 free unlocks

Unlock quizzes for free by uploading documents