Consider the following supply table, which represents the supply of comic books by Bill, Judy, and Sally. (a) Fill in the "market supply" column of the above table.
(b) Use the grid below to draw the supply curves for comic books of Bill, Judy, and Sally.Then draw in the market supply curve. 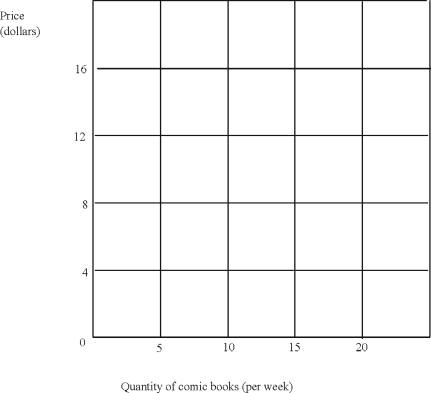 (c) Compare the supply curve you have drawn for Sally and Judy.Which of these two is more influenced by increases in the price of comic books? Explain.
Correct Answer:
Verified
View Answer
Unlock this answer now
Get Access to more Verified Answers free of charge
Q2: What are the "other things constant" when
Q8: The diagram below represents the producer side
Q9: The diagram below represents the consumer side
Q10: In one year, the price of soybeans
Q12: Demonstrate graphically and explain the difference between
Q14: Use examples to demonstrate why the ability
Q15: How is the "Law of Demand" different
Q16: What is meant by "the fallacy of
Q19: John and Steve are roommates at Siberian
Q20: Explain what it means to say that
Unlock this Answer For Free Now!
View this answer and more for free by performing one of the following actions

Scan the QR code to install the App and get 2 free unlocks

Unlock quizzes for free by uploading documents