Which of the graphs below is the correct depiction of the yield curve given the data on the three zero coupon bonds in the table below? Zero Coupon Bond Prices and Yields
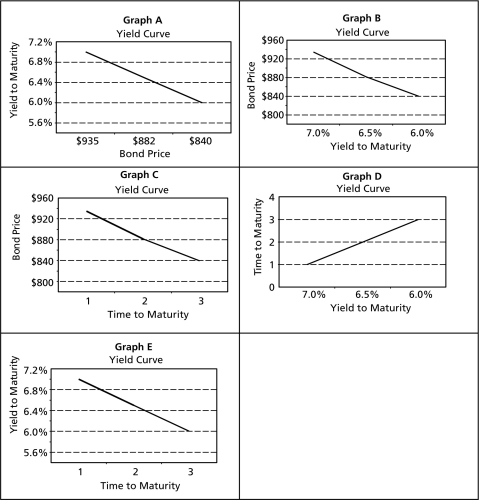
A) Graph A
B) Graph B
C) Graph C
D) Graph D
E) Graph E
Correct Answer:
Verified
Q5: To raise funds for Gravina Island Bridge,the
Q6: Crystal Clear Inc.is undertaking a new investment
Q7: The 5-year T-Note yields 6% and the
Q8: At the latest auction,1-year T-Bills were priced
Q9: The table, below, shows market prices
Q12: The nominal rate of interest is 6%
Q14: The prices of three zero-coupon bonds
Q15: The prices of a number of
Q16: Consider a $1,000 face value zero coupon
Q17: How much should an investor pay for
Unlock this Answer For Free Now!
View this answer and more for free by performing one of the following actions

Scan the QR code to install the App and get 2 free unlocks

Unlock quizzes for free by uploading documents