The table below shows market prices for four zero coupon bonds with four different terms: one, two, three and four years. The bonds all have a face value of $1,000. Which line best represents the yield curve derived from the bond prices in the table? Use the letter labels at the end of each line. Zero Coupon Bond Prices
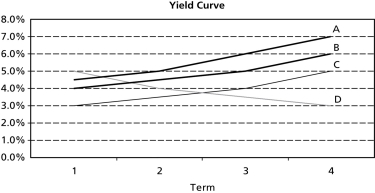
A) A
B) B
C) C
D) D
Correct Answer:
Verified
Q23: In September 2000 the Pullman Group arranged
Q25: Consider a 30 year coupon bond with
Q29: Consider a 35 year coupon bond that
Q30: Consider a 6-year corporate bond issued by
Q32: The Federal Government 2-year coupon bond has
Q35: To raise funds for Gravina Island Bridge,the
Q36: You just purchased a Federal Government bond
Q38: 3M bonds are currently trading at $1,104.07.The
Q39: Acme Inc.just issued a bond with a
Q40: A U.S.Government T-Bond with a 15-year maturity
Unlock this Answer For Free Now!
View this answer and more for free by performing one of the following actions

Scan the QR code to install the App and get 2 free unlocks

Unlock quizzes for free by uploading documents