Data extracted from the accounting information system of NYX Corporation produced the following graph. The equation of the dashed line is y = $25x; the equation of the solid line is y = $200 + $5x. : 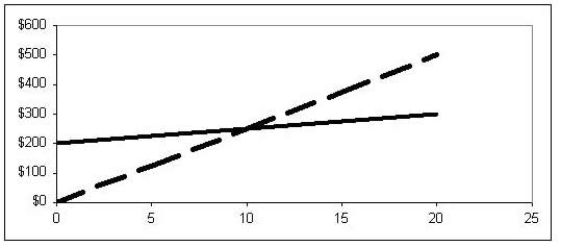 Which of the following terms best describes the graph?
A) Cost-volume-profit graph.
B) Operating leverage graph.
C) Margin of safety graph.
D) Revenue graph.
Correct Answer:
Verified
Q92: The breakeven point for a wholesaler will
Q93: Nickleby sells its single product for $14
Q94: Data extracted from the accounting information system
Q95: At a breakeven point of 20,000 units,
Q96: Endeavour Ltd. is a management consulting firm
Q98: Pura Vida manufactures a single product. The
Q99: Echo Ltd sells its single product for
Q100: Eve's Emporium sells three products which
Q101: Kelly Co. incurs $465, 000 in
Q102: Kelly Co. incurs $465,000 in fixed
Unlock this Answer For Free Now!
View this answer and more for free by performing one of the following actions

Scan the QR code to install the App and get 2 free unlocks

Unlock quizzes for free by uploading documents