(Figure: Simple Keynesian Model) Based on the figure above, which of the following graphs would best represent the associated saving-investment? 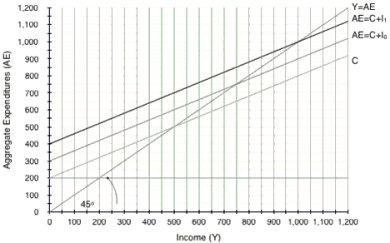
A) 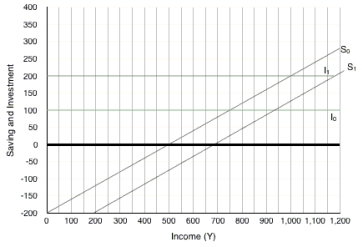
B) 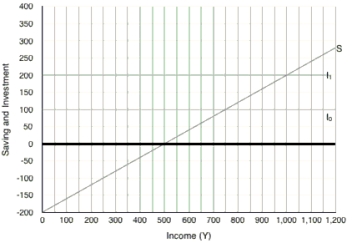
C) 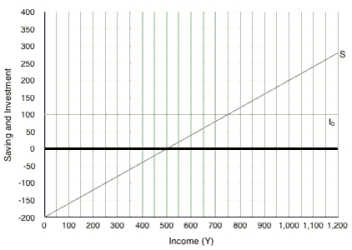
D) 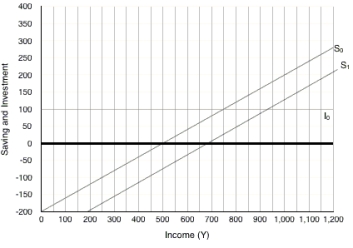
Correct Answer:
Verified
Q83: Equilibrium in the Keynesian model requires that
Q138: Suppose the government believes consumers should spend
Q139: In the simple Keynesian model with no
Q141: Suppose economists observe that an increase in
Q143: Which country has the lowest national savings
Q144: Assume the economy is currently experiencing aggregate
Q145: If the multiplier is 2 and investment
Q146: (Figure: Simple Keynesian Model) In the figure
Q147: If the marginal propensity to consume is
Q246: When the economy is in equilibrium in
Unlock this Answer For Free Now!
View this answer and more for free by performing one of the following actions

Scan the QR code to install the App and get 2 free unlocks

Unlock quizzes for free by uploading documents