(Figure: Determining Surplus) In the graph, which shape represents consumer surplus? 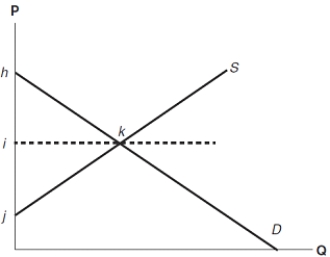
A) the triangle hjk
B) the line hij
C) the line hi
D) the triangle hik
Correct Answer:
Verified
Q4: If a consumer is willing to pay
Q41: The difference between market price and the
Q44: Consumer surplus is shown graphically as the
Q48: Suppose the market price is $5. There
Q50: Producer surplus is shown graphically as the
Q85: Producer surplus is the
A) difference between market
Q156: Producer surplus is the area
A) above the
Q181: All else equal, consumers prefer market outcomes
Q184: If you are willing to sell your
Q290: Suppose the actual price for good A
Unlock this Answer For Free Now!
View this answer and more for free by performing one of the following actions

Scan the QR code to install the App and get 2 free unlocks

Unlock quizzes for free by uploading documents