(Figure: Understanding Surplus and Efficiency) In the graph, what is the sum of consumer and producer surplus? 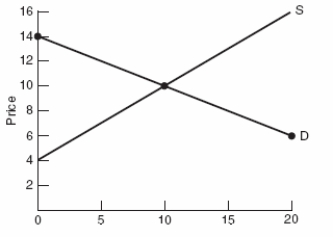
A) $30
B) $140
C) $50
D) $0
Correct Answer:
Verified
Q73: (Figure: Determining Surplus 3) In the graph,
Q74: (Figure: Determining Surplus 4) In the graph,
Q75: (Figure: Determining Surplus 2) In the graph,
Q76: (Figure: Determining Surplus 3) In the graph,
Q77: (Figure: Determining Surplus 3) In the graph,
Q79: (Figure: Determining Surplus) In the graph, what
Q80: (Figure: Determining Surplus 4) In the graph,
Q81: (Figure: Understanding Surplus and Efficiency) In the
Q82: (Figure: Interpreting Surplus) In the supply/demand graph:
Q83: If demand for a product rises, what
Unlock this Answer For Free Now!
View this answer and more for free by performing one of the following actions

Scan the QR code to install the App and get 2 free unlocks

Unlock quizzes for free by uploading documents