(Figure: Understanding Surplus and Efficiency) In the graph above, efficiency in this market is achieved at a price of: 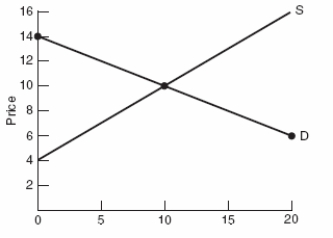
A) $14.
B) $10.
C) $4.
D) $0.
Correct Answer:
Verified
Q57: If the price of a good is
Q93: (Figure: Determining Surplus 6) The maximum possible
Q94: (Figure: Determining Surplus 5) According to the
Q95: (Figure: Determining Total Surplus) In the graph,
Q96: When supply of a product increases, ceteris
Q97: (Figure: Determining Surplus 6) Using the graph,
Q99: At the equilibrium price:
A) either a shortage
Q102: (Figure: Determining Surplus and Loss) In the
Q199: When demand for a product falls, ceteris
Q204: If the price of a good falls
Unlock this Answer For Free Now!
View this answer and more for free by performing one of the following actions

Scan the QR code to install the App and get 2 free unlocks

Unlock quizzes for free by uploading documents