(Figure: Determining Surplus and Loss) In the graph, $6 would allow for an effective price ceiling. 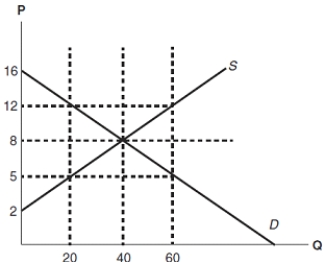
Correct Answer:
Verified
Q315: (Figure: Determining Surplus and Loss) In the
Q316: (Figure: Determining Surplus and Loss) In the
Q317: (Figure: Understanding Price Ceilings and Floors) In
Q318: If a price ceiling is set above
Q319: (Figure: Determining Surplus and Loss) In the
Q321: (Figure: Understanding Price Ceilings and Floors) In
Q322: (Figure: Understanding Price Ceilings and Floors) In
Q323: (Figure: Understanding Price Ceilings and Floors) In
Q324: (Figure: Determining Surplus and Loss) In the
Q325: (Figure: Understanding Price Ceilings and Floors) In
Unlock this Answer For Free Now!
View this answer and more for free by performing one of the following actions

Scan the QR code to install the App and get 2 free unlocks

Unlock quizzes for free by uploading documents