The equation for the demand curve for bags of Doritos is P = 6 + (-1) × Q. Which graph shows the CORRECT demand curve?
A) 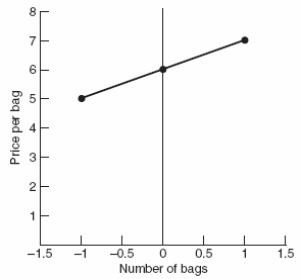
B) 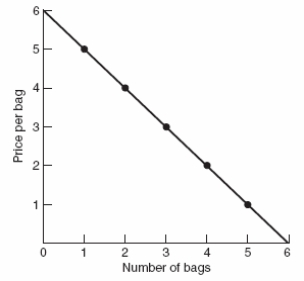
C) 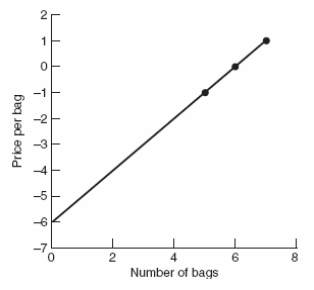
Correct Answer:
Verified
Q61: (Table) The table shows the demand
Q62: (Figure: Demand for Shoes) A shift to
Q65: If a consumer buys a set of
Q67: In general terms, which item is an
Q68: (Figure: Market for Shoes) If the price
Q69: (Figure: Demand for Shoes) A shift to
Q70: (Figure: Market for Shoes) The graph represents:
Q71: A shift in the demand curve is
Q159: If the demand for iPhones rises as
Q296: Which factor would shift the demand curve
Unlock this Answer For Free Now!
View this answer and more for free by performing one of the following actions

Scan the QR code to install the App and get 2 free unlocks

Unlock quizzes for free by uploading documents