(Figure: Interpreting a Market Graph) The graph represents: 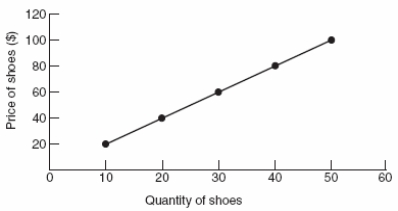
A) willingness-to-pay.
B) the price system.
C) the law of supply.
D) the law of demand.
Correct Answer:
Verified
Q126: The supply curve
A) slopes downward and to
Q129: (Figure: Interpreting Supply Shifts 2) A shift
Q132: Which item is NOT a determinant of
Q133: The fundamental reason why supply curves slope
Q135: The law of supply states that, if
Q136: The supply curve slopes up and to
Q137: (Figure: Interpreting a Market Graph) If the
Q139: (Figure: Interpreting a Market Graph) If the
Q207: Supply refers to the
A) maximum price that
Q273: A graphical representation of how much product
Unlock this Answer For Free Now!
View this answer and more for free by performing one of the following actions

Scan the QR code to install the App and get 2 free unlocks

Unlock quizzes for free by uploading documents